Employer of Record vs PEO
What’s the smarter path to growth? An Employer of Record that eliminates the need for legal entities or a PEO that optimizes your existing infrastructure?

Young adults face unprecedented challenges on their road to financial freedom in the current economy due to soaring inflation and the rising cost of living. As the biggest financial priority for many U.S. workers is paying off debt and building emergency savings, the question that arises is what does the retirement outlook for U.S. workers looks like?
While the FIRE movement (Financial Independence, Retire Early) has gained traction, the federal data indicates that retirement plan participation is low and stagnating. This article explores the projected 401k value, trends, and factors surrounding these alarming retirement participation rates.
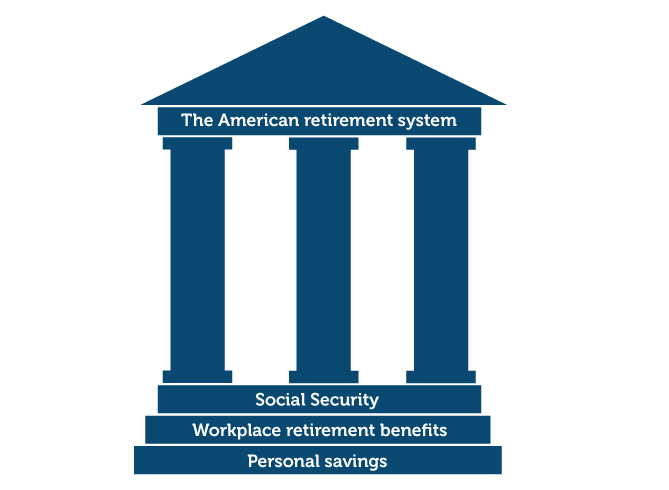
The American retirement system is set up to operate on a three-pillar model, which includes Social Security, workplace retirement benefits, and personal savings.
However, with increasing longevity and declining birth rates, retirement systems have been grappling with long-term sustainability. For example, the defined-benefit plans, or pensions, are being replaced with defined-contribution plans.
As of March 2021, 53% of private industry employees had access to defined-contribution plans such as a 401(k), while only 3% had access to defined-benefit plans, and 12% had access to both.

Significant global events recently accelerated changes and caused widespread shifts in societal expectations, needs, and behaviors. Amid the pandemic, the retirement readiness and financial priorities changed dramatically for part-time and full-time workers.
According to one report, 16% of workers stated their retirement confidence has declined. In addition, only three in four workers are confident they will be able to fully retire with a comfortable lifestyle.
The Federal Reserve data shows that one-fourth of non-retired adults do not have any retirement savings.
The retirement savings gap is the difference between what retirement savers need and what they have accumulated.
The latest data shows that this retirement gap is widening and is now approaching an estimated $4 trillion.
The economic impact of the recent market losses, especially in sectors hit hard by the pandemic such as hospitality and leisure, forced many employers to suspend or change their retirement contributions – further widening the retirement savings gap.
We have experienced a silver tsunami of Baby Boomers leaving the workforce these last two years, often dubbed “The Great Retirement.”
According to one estimate, there are 3.3 million more retirees as of October 2021, than in January 2020. Following the longest bull market run in history, spanning more than ten years, older workers flush with increased investment, and home values left the workforce in droves.

To help address the coverage gap over the last year, more states began to offer retirement plans for employees of small businesses. Hence, one emerging retirement industry trend is the defined contribution pension plans known as Pooled Employer Plans (PEP). These plans offer lower fees for retirement savers and better liability protection for small business owners than a single-employer 401(k) plan (SEP).
As it stands, the retirement plan coverage is low for all workers; however, these aggregate numbers often hide disparities by income, race, age, and gender. Understanding how these disparities profoundly affect a worker’s ability to prepare for a financially secure retirement can shed light on inequalities and help strengthen the retirement system.
Living longer in retirement puts pressure on workers to have more money saved, as the average life expectancy for men is around 84 years and 86.5 years for women. In addition, healthcare and long-term care costs continue to rise faster than inflation, increasing the risk that retirement savings are inadequate. According to Fidelity, here are some retirement age trends to serve as a benchmark and assess if you are on track:
|
Under 25 years: Save 15% of your pre-tax income |
|
By age 30 - have the equivalent of one year's salary in your workplace retirement plan. |
|
By age 40 - have a multiple of three times your salary saved up |
|
By age 50 - have accumulated a multiple of six times your salary |
|
By age 60 – have eight times your salary saved up |
However, the reality of how much American workers have saved up for each age group can be seen in the table below. It clearly shows the savings gap, a big difference between the recommended savings and how much the average worker has saved up.
|
AGE |
AVERAGE 401K BALANCE |
MEDIAN 401K BALANCE |
|
<25 |
$6,718 |
$2,240 |
|
25-34 |
$33,272 |
$13,265 |
|
35-44 |
$86,582 |
$32,664 |
|
45-54 |
$161,079 |
$56,722 |
|
55-64 |
$232,379 |
$84,714 |
|
65+ |
$255,151 |
$82,297 |
Undoubtedly, there are long-standing and substantial wealth disparities between different racial and ethnic groups. According to the Federal Reserve’s survey, White non-Hispanic households are more than 60% more likely to have retirement accounts than Black households and more than twice as likely as Latinx households.
For working-age families with IRA and DC plans, the typical White family has about $50,000 saved, which is two and a half times the amount saved as the typical Black and Latinx family, who have about $20,000 saved.
In addition, Black and Hispanic families have disproportionate lower access to employer-sponsored retirement plans than White families- for every three White families that can access an employer-sponsored retirement plan, only two Hispanic families have access.
|
RACE |
ACCESS TO A |
PARTICIPATION IN |
|
White |
68% |
60% |
|
Black |
56% |
44% |
|
Hispanic |
44% |
34% |
|
Other |
61% |
54% |
Overall, these gaps in retirement plan access, participation and contributions, and account balances suggest that minority groups will be less financially secure in retirement.
Women also face many unique challenges in securing enough wealth for retirement due to wage inequality, fewer working years due to childcare and other care obligations, and greater longevity.
Altogether, these factors result in women often arriving at retirement with less savings, only being eligible for lower Social Security benefits, and with the prospect of living longer in retirement than male counterparts.
|
GENDER |
AVERAGE 401K |
MEDIAN 401K BALANCE |
|
Male |
$156,121 |
$42,516 |
|
Female |
$107,147 |
$29,095 |
Gender is also a notable factor in establishing retirement security as it influences current balances. Vanguard’s report states that 56% of pension participants are male and have average and median balances almost 50% higher than those of women.
By now, one may wonder about the expected investment returns between different plans and if it is worth having a 401(k) plan. Estimating the future returns and projected 401k value on a portfolio may seem like an impossible task to many workers.
The simplest explanation for this is that the rate of return is directly correlated to the investment portfolio and a number of economic and market risk factors.
Depending on how the employee diversified their investments between stocks & bonds, mutual funds & exchange-traded funds (ETFs), they can provide an average annual return ranging from 3% to 8%.
Additionally, the best 401(k) return expectations need to account for different factors such as the percentage of contributions, investment selection and its performance, and other pension costs and fees. Regardless of how the employee builds a 401k portfolio, the asset allocation needs to match the risk tolerance, as well as the time horizon – the time left until retirement.
Most commonly, the optimal portfolio for more conservative investors, or those closer to retirement, is the 60/40 – a mix of 60% stocks and 40% bonds. Younger investors or those with a slightly higher risk appetite can adjust these percentages to match their needs.
|
MARKET RETURNS |
1 YEAR |
3 YEARS |
5 YEARS |
|
60/40 Balanced |
16.1% |
10.4% |
10.8% |
|
70/30 Balanced |
17.1 |
11.1 |
11.7 |
|
S&P 500 |
18.4 |
14.2 |
15.2 |
|
Bloomberg Barclays US Aggregate |
7.5 |
5.3 |
4.4 |
|
FTSE Developed ex US |
10.3 |
4.8 |
8.2 |
As shown in the table above, despite the high market volatility experienced in 2020, overall stock prices increased by 16%. Although the past performance of a market is not a guarantee for future returns, the overall 401k projected value is still expected to grow. One figure that supports this is the fact that over the last two hundred years, stocks have produced a real return of 7% per year (adjusted for inflation).
Nowadays, there are a plethora of 401k calculators available that can provide a projected 401k growth for your specific portfolio.
The golden rule of the market is “don’t try to time the market.”
As with any investment, there are certain risks involved. One of the most daunting scenarios for employees today is the thought of a recession as they reach retirement. What does a recession mean for you and your projected 401k value?
Truth be told, there is no answer to how a recession would affect a 401k value projection.
However, some peace of mind can be gained from the following facts:
If a recession is to happen, it is essential to stay the course, don’t sell, and don’t panic. Contrary to conventional wisdom, many brave investors see recessions as an opportunity to buy more aggressively when the market dips.
While having to retire during a recession or bear market is not an ideal scenario, there are certain steps future retirees can take to protect their portfolios from long-term fallout. The best way to future-proof retirement is to diversify investments – pensions, Social Security, and annuities are all examples of stable income sources.
Ideally, if you’re nearing retirement, you may consider keeping enough cash in a safe location like a savings account to help ride out any possible fluctuations or market crashes.
Regardless of the improvements, the current design of the American retirement system leaves out most part-time workers, especially low-income workers and minorities.
While the headline may state that workplace retirement plans do not cover almost 40% of private industry employees, there are many notable differences within that number. One such example is that a greater proportion of full-time workers (80%) are offered a 401(k) plan or a similar retirement plan by their employer than part-time workers (51%).
As if that’s not enough, this disparity is also observed across various industries. For example, finance, insurance, and real estate employees have the highest participation rates, with nine in ten workers participating in their employer’s plan.
In comparison, employees in the wholesale and retail trade group have the lowest participation rate at 61%.
Workers in the lower-income group are also more likely to access their plan savings before retirement and take out a loan. In 2020, one in four participants with a household income ranging from $30,000 to $99,000 had a loan, while only 13% of participants with an income of more than $150,000 had one.
Early 401k cashouts are also subject to 10% tax penalties imposed by the IRS. The level of hardship withdrawals remains relatively low, with only 2.8% of DC plan participants taking withdrawals in the first half of 2021.
Even though the last couple of years provided much instability for workers, the future is looking bright.
As more employers are introducing new plan design features like automated enrollment, the number of employee participation is also rising. According to Vanguard’s estimate, plans with automatic enrollment had a 92% participation rate, compared with a 62% participation rate for plans with voluntary enrollment.
When choosing a retirement plan, the employee must consider the current tax bracket and projected future tax bracket, as retirement plans offer different tax benefits. Traditional 401k contributions are made with pre-tax dollars reducing the current taxable income, while Roth 401k plans are funded with after-tax dollars, but withdrawals are tax-free.
Therefore, choosing the right plan can significantly impact credit and further deductions.
Employees’ benefits extend beyond having a tax-free investment growth to include employer contributions, systematic saving and reinvestment, and various investment options.
Other advantages of having a DC plan like a 401k or 403b include:
While those are significant advantages, defined-benefit plans or pension plans offer some benefits too:
For young workers, retirement savings may be low on their list of worries and priorities. Even so, the biggest impact one can make to secure their financial future and to increase their projected 401k value is to start saving early. By diverting a portion of the paycheck, wealth can compound and grow exponentially, helping employees live out their golden years comfortably and peacefully.
Disclosure: The information provided in this post is for general informational purposes only and should not be considered as legal, tax, accounting, or investment advice. For advice on specific issues, please consult with a qualified professional.
Browse our curated list of vendors to find the best solution for your needs.
Subscribe to our newsletter for the latest trends, expert tips, and workplace insights!

What’s the smarter path to growth? An Employer of Record that eliminates the need for legal entities or a PEO that optimizes your existing infrastructure?

Just switched jobs? What you do with your 401(k) next could either save or drain thousands from your retirement.

Explore valuable intent data statistics to learn how it can help companies better understand prospects and offer adequate solutions to their needs.

As webinars grow in popularity and convenience, we look at the tools that make them possible. Learn how to choose webinar software that’s reliable, user-friendly, and has all the right features.
Used by most of the top employee benefits consultants in the US, Shortlister is where you can find, research and select HR and benefits vendors for your clients.
Shortlister helps you reach your ideal prospects. Claim your free account to control your message and receive employer, consultant and health plan leads.